Share Price Volatility and Swing Trading
Typing "volatility" into Google yields some pretty interesting and, in my
opinion, pretty confused results. The top result from my search was
this
one from Wikipedia and it says it all. There seem to be many
non-scientists regarding volatility as a financial market rainbow, with a crock
of gold at the end of it.
Anyone with the most basic grounding in geometrical optics knows that a rain "bow" is really a segment of a rain "ring" and the centre of that ring, and your head, and the sun, all form a straight line, and the angle between that line and the line from your head to the colored rings is a function of the size of the rain droplets. So the rainbow moves with you. You can never reach out and touch the rings, and you can certainly never navigate to the "base", conceptual or otherwise.
I suspect volatility is similar. From much of what is written there seem to be a fair few searching for crocks of gold, without a clear grasp of the mechanics.
The closest I found to a coherent definition of volatility is standard deviation. This is is a widely used statistical measure which is easy enough to calculate. And while it may have applications in calculating the prices of certain esoteric financial instruments, I am not sure of its direct application to the construction of a trading strategy, or to the selection of shares suitable for short term swing trading. To illustrate, I'll use my favorite mathematical construct, the sine wave.
The chart below shows a hypothetical price time graph for a hypothetical company, ABC Co. The mean share price is $1.50, and the standard deviation is 71c.
 The chart below shows a hypothetical price time graph for a second
hypothetical company, XYZ Co. The mean price is also $1.50, and the standard deviation is
also 71c.
The chart below shows a hypothetical price time graph for a second
hypothetical company, XYZ Co. The mean price is also $1.50, and the standard deviation is
also 71c.
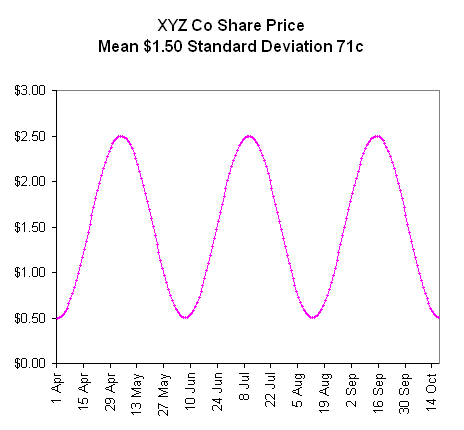 So the standard deviation is identical for both companies, and yet from a
common sense perspective most people would describe the share price of XYZ Co as
being much more volatile than that of ABC Co. So on that basis, standard
deviation, does not seem to represent a good estimate of volatility.
So the standard deviation is identical for both companies, and yet from a
common sense perspective most people would describe the share price of XYZ Co as
being much more volatile than that of ABC Co. So on that basis, standard
deviation, does not seem to represent a good estimate of volatility.
And from a swing trading perspective the two companies are very different. ABC Co offers a swing trader one buy-sell cycle and a chance to buy back at the end of the period. XYC Co offers a swing trader three buy-sell cycles over the same period, as well as a buy back opportunity at the end.
Without pretending to be a professional mathematician, my gut feeling is that there will be no simple mathematical formula to identify a share price pattern conducive to profitable trading. Rather a more long hand approach will be needed, setting trading parameters, and then tracking a share price over time to generate hypothetical trading results.
Anyone with the most basic grounding in geometrical optics knows that a rain "bow" is really a segment of a rain "ring" and the centre of that ring, and your head, and the sun, all form a straight line, and the angle between that line and the line from your head to the colored rings is a function of the size of the rain droplets. So the rainbow moves with you. You can never reach out and touch the rings, and you can certainly never navigate to the "base", conceptual or otherwise.
I suspect volatility is similar. From much of what is written there seem to be a fair few searching for crocks of gold, without a clear grasp of the mechanics.
The closest I found to a coherent definition of volatility is standard deviation. This is is a widely used statistical measure which is easy enough to calculate. And while it may have applications in calculating the prices of certain esoteric financial instruments, I am not sure of its direct application to the construction of a trading strategy, or to the selection of shares suitable for short term swing trading. To illustrate, I'll use my favorite mathematical construct, the sine wave.
The chart below shows a hypothetical price time graph for a hypothetical company, ABC Co. The mean share price is $1.50, and the standard deviation is 71c.
And from a swing trading perspective the two companies are very different. ABC Co offers a swing trader one buy-sell cycle and a chance to buy back at the end of the period. XYC Co offers a swing trader three buy-sell cycles over the same period, as well as a buy back opportunity at the end.
Without pretending to be a professional mathematician, my gut feeling is that there will be no simple mathematical formula to identify a share price pattern conducive to profitable trading. Rather a more long hand approach will be needed, setting trading parameters, and then tracking a share price over time to generate hypothetical trading results.


Comments